Troubleshooting a hanging task run
When your Job task hangs, get the observability metrics to identify causes.-
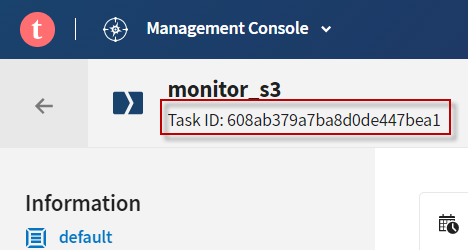
Get the ID of the task run to be analyzed. In Talend Cloud Management Console, this ID is displayed on the dedicated page of the task to be monitored. For example:
Or you can obtain task IDs via the following API request:
method: GET endpoint: https://api.<env>.cloud.talend.com/processing/executables/tasks headers: { "Content-Type": "application/json", "Authorization": "Bearer <your_personal_access_token_or_service_account_token>" } query parameters: { "workspaceId": "id_of_the_workspace_of_the_task_to_be_monitored" } -
Get the ID of the task run to be analyzed. This ID is available on the Task execution log page in Talend Cloud Management Console, reading as Task execution ID. Or you can obtain this ID via a
GETcall from the/processing/executables/tasks/{taskId}/executionsendpoint. -
Issue the following API request to find the components that are still running:
method: GET endpoint: https://api.<env>.cloud.talend.com/monitoring/observability/executions/{runId}/component headers: { "Authorization": "Bearer <your_personal_access_token_or_service_account_token>" } payload: N/A -
Analyze the response to identify the component for which the
component_execution_duration_millisecondsfield is not available. -
Issue another API request to find which components handles the most records:
method: GET endpoint: https://api.<env>.cloud.talend.com/monitoring/observability/executions/{runId}/component?sortBy=component_connection_rows_total&sortOrder=desc headers: { "Authorization": "Bearer <your_personal_access_token_or_service_account_token>" } payload: N/A -
Issue this API request to find which component runs for the longest time:
method: GET
endpoint:
   https://api.<env>.cloud.talend.com/monitoring/observability/executions/{runId}/component?sortBy=component_execution_duration_milliseconds&sortOrder=desc
headers: {
 "Authorization": "Bearer <your_personal_access_token_or_service_account_token>"
}
payload: N/A
- By component name, you can tell whether some of the components you identified above are connection components, for example, tMongoDBConnection. If they are, the issue could lie in connection.
- Examine the health status of the Cloud engine where your task was run.
- Read information about these components in the log of this task run. You can read this log either on the Run overview page in Talend Cloud Management Console or via API, as explained in Getting a task run log for live monitoring.
Below is an example of the response of the GET request at /monitoring/observability/executions/{runId}/component.
{
    "account_id": "2be59707-2230-45dc-a43d-db7e6d798425",
    "engine_id": "a60bb1c0-7669-407f-9326-138af05da18a",
    "engine_type": "CLOUD",
    "engine_version": "2.10.8",
    "workspace_id": "61273932d0366133d05729b7",
    "task_id": "612739e79a0ac71b8f3ed4dd",
    "task_execution_id": "947e3e2f-d199-4988-a5ab-14ceb36c80f3",
    "artifact_id": "612739e79a0ac71b8f3ed4db",
    "artifact_name": "job_with_rejected_rows",
    "artifact_version": "0.1.0.20212608065119",
    "start_time": "2021-08-26T06:53:30.127Z",
    "finish_time": "2021-08-26T06:53:35.361Z",
    "rows_rejected": 1,
    "operator": "admin",
    "operator_type": "HUMAN",
    "processes": [
        {
            "process_id": "0329f8d4-1c69-3372-9233-d38ac6ef03a8",
            "job_name": "MainJob",
            "pid": "20210806181617_2Y68h",
            "father_pid": "20210806181617_2Y68h",
            "root_pid": "20210806181617_2Y68h"
        }
    ],
    "metrics": {
        "items": [
            {
                "pid": "20210806181617_2Y68h",
                "connector_type": "tMongoDBConnection",
                "connector_label": "tMongoDBConnection_1",
                "connector_id": "tMongoDBConnection_1",
                "component_start_time_seconds": 1628266578
            },
            {
                "pid": "20210806181617_2Y68h",
                "connector_type": "tRowGenerator",
                "connector_label": "tRowGenerator_1",
                "connector_id": "tRowGenerator_1",
                "target_connector_type": "tFlowMeter",
                "target_label": "vFlowMeter_row1",
                "target_id": "vFlowMeter_row1",
                "component_start_time_seconds": 1628266578,
                "component_connection_rows_total": 5000000,
                "component_execution_duration_milliseconds": 491585
            },
            {
                "pid": "20210806181617_2Y68h",
                "connector_type": "tFlowMeter",
                "connector_label": "vFlowMeter_row1",
                "connector_id": "vFlowMeter_row1",
                "component_start_time_seconds": 1628266578
            },
            {
                "pid": "20210806181617_2Y68h",
                "connector_type": "tFlowMeter",
                "connector_label": "vFlowMeter_row1",
                "connector_id": "vFlowMeter_row1",
                "target_connector_type": "tMongoDBOutput",
                "target_label": "Insert from SQL",
                "target_id": "tMongoDBOutput_1",
                "component_start_time_seconds": 1628266578,
                "component_connection_rows_total": 5000000,
                "component_execution_duration_milliseconds": 491605
            },
            {
                "pid": "20210806181617_2Y68h",
                "connector_type": "tMongoDBOutput",
                "connector_label": "Insert from SQL",
                "connector_id": "tMongoDBOutput_1",
                "component_start_time_seconds": 1628266578
            },
            {
                "pid": "20210806181617_2Y68h",
                "connector_type": "tMongoDBInput",
                "connector_label": "tMongoDBInput_2",
                "connector_id": "tMongoDBInput_2",
                "target_connector_type": "tLogRow",
                "target_label": "tLogRow_2",
                "target_id": "tLogRow_2",
                "component_start_time_seconds": 1628267070,
                "component_connection_rows_total": 2158754
            },
            {
                "pid": "20210806181617_2Y68h",
                "connector_type": "tLogRow",
                "connector_label": "tLogRow_2",
                "connector_id": "tLogRow_2",
                "component_start_time_seconds": 1628267070
            }
        ],
        "limit": 50,
        "offset": 0,
        "total": 7
    }
}